In today’s technology-driven world, understanding how to calculate CPU usage is a fundamental skill for developers, IT administrators, and tech enthusiasts.
Calculate CPU usage by tracking active vs. idle time using Task Manager, `top`, or Python’s `psutil`. Monitor regularly to optimize performance and detect issues.
Curious about your system’s performance? Learn how to calculate CPU usage and keep your devices running smoothly!
Table of Contents
Why Calculate CPU Usage?
Before diving into the “how,” let’s explore the “why.” Monitoring CPU usage is crucial for several reasons:

- System Performance Monitoring: Detect performance bottlenecks.
- Load Balancing: Distribute workloads evenly across servers.
- Power Optimization: Optimize resource usage to save energy.
- Debugging and Troubleshooting: Identify issues like infinite loops or high resource consumption.
Understanding CPU Usage Metrics
CPU usage is expressed as a percentage, indicating how much time the CPU spends executing tasks versus being idle. The formula to calculate CPU usage is:
CPU Usage (%)=(1−Total Time divided by Idle Time)×100
Key Terms:
Idle Time: The time the CPU is not executing any tasks.
Total Time: The cumulative time, including both active and idle states.
Read Also: Mtl Compiler Service High Cpu – Here’s What To Do!
How to Calculate CPU Usage on Different Platforms
Different operating systems provide built-in tools and commands to measure CPU usage effectively.
1. Windows:
Windows users can easily monitor CPU usage using Task Manager:
- Press Ctrl + Shift + Esc to open Task Manager.
- Navigate to the Performance tab.
- Here, you’ll see real-time CPU usage along with a breakdown of processes consuming the most resources.
- For advanced monitoring, use Windows Performance Monitor (Perfmon). It provides detailed insights and lets you set alerts for high CPU usage.
2. Linux:
Linux users have several options to monitor CPU activity:
- Top Command: The top command provides a dynamic view of running processes and their CPU consumption. Simply type top in the terminal.
- Htop Command: Similar to top, but more interactive, htop displays a visual representation of CPU usage.
- Vmstat Command: The vmstat command offers a summary of system performance, including CPU metrics. Execute it with vmstat 1 5 to sample CPU activity at one-second intervals for five times.
For more detailed monitoring, tools like Nagios or Zabbix are excellent options.
3. MacOS:
On MacOS, the Activity Monitor is your go-to tool:
- Open Activity Monitor from the Utilities folder.
- Click on the CPU tab to see a list of processes and their CPU usage in real time.
- You’ll also find a graph that visualizes CPU load over time.
Automating CPU Usage Monitoring
While built-in tools are useful, automation can simplify repetitive tasks, especially in server or development environments. Here’s how you can programmatically calculate CPU usage using scripts.

Python with Psutil:
Python’s psutil library is a versatile tool for monitoring system performance. It’s easy to install and works across platforms.
Linux /proc/stat File:
Linux systems store CPU activity data in the /proc/stat file. Advanced users can write scripts to read this file and analyze CPU metrics over time.
Third-Party Monitoring Tools:
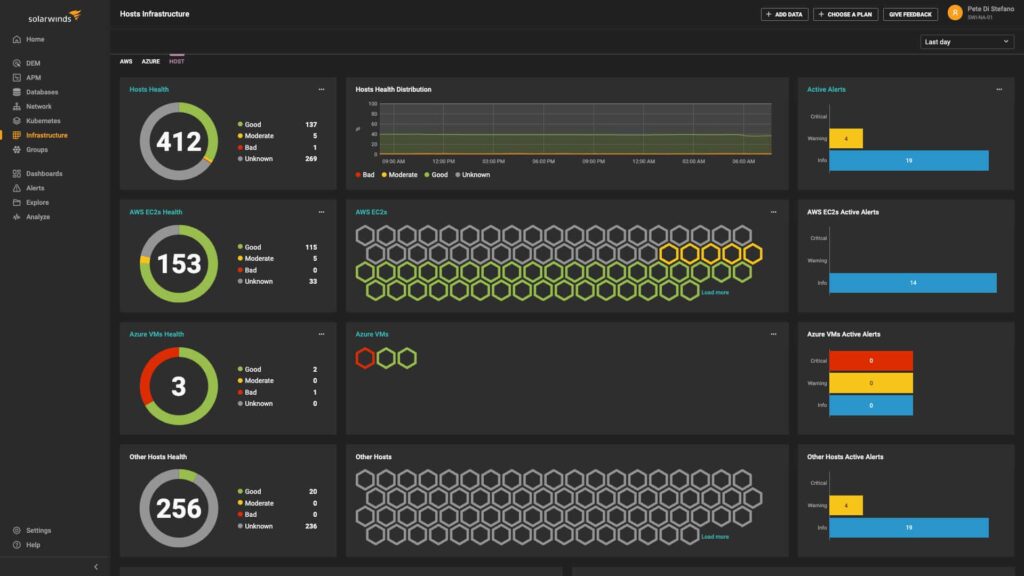
For large-scale environments, third-party solutions like SolarWinds or Datadog offer advanced features like trend analysis, reporting, and alerts.
Read Also: B450 Tomahawk Cpu Compatibility – Full Compatibility List!
Best Practices for Monitoring CPU Usage
Set Baseline Metrics:
Understand what normal CPU usage looks like for your system. This helps identify deviations that require attention.
Monitor Trends Over Time:
Short-term spikes may not always indicate issues. Regular monitoring helps spot patterns and plan resource upgrades.
Automate Alerts:
Use tools or scripts to send notifications when CPU usage crosses a predefined threshold.
Optimize Applications:
If certain programs consistently consume excessive CPU, consider updating, optimizing, or replacing them.
Common Challenges and How to Address Them
Short-Term Spikes:
It’s normal for CPU usage to spike briefly during intensive tasks like software installation or video rendering. However, sustained high usage requires investigation.
Solution: Focus on monitoring sustained usage rather than short-term activity.
Background Processes:
Hidden background tasks often contribute to high CPU usage.
Solution: Use system tools like Task Manager or top to identify and terminate unnecessary processes.
Cross-Platform Compatibility:
Different platforms handle CPU monitoring differently, making it tricky to standardize methods.
Solution: Use cross-platform libraries like psutil for consistent results.
Read Also: Cpu Vs Cpu Package Temp – What You Need To Know!
CPU Usage Tools You Should Know
1. Built-In Tools:
- Task Manager (Windows)
- Activity Monitor (MacOS)
- top, htop, and vmstat (Linux)
2. Third-Party Tools:
- SolarWinds
- Nagios
- Datadog
3. Programming Libraries:
- Python’s psutil
- Windows Performance Counters
Applications of CPU Usage Monitoring

- Gaming Performance: Gamers monitor CPU usage to ensure smooth gameplay and avoid lags caused by overheating or resource-intensive processes.
- Server Load Balancing: Web hosts use CPU metrics to distribute workloads across servers, preventing outages during high traffic.
- Software Development: Developers monitor CPU usage to test the efficiency of their code and identify bottlenecks.
- System Security: Abnormal CPU usage can signal malware or unauthorized programs. Regular monitoring helps maintain security.
Frequently Asked Questions:
1. How can I measure CPU usage for a specific application?
Most operating systems let you track CPU usage per application. Use tools like Task Manager (Windows) or Activity Monitor (Mac) to filter processes and analyze individual app usage.
2. Can I monitor CPU usage remotely?
Yes, remote monitoring is possible using tools like Nagios, Datadog, or custom scripts with SSH. These solutions provide insights into CPU usage for servers and devices from a remote location.
3. What are lightweight tools for minimal CPU monitoring?
For minimal system overhead, tools like conky (Linux) or Rainmeter (Windows) offer lightweight CPU usage tracking and simple visual dashboards.
4. How does virtual machine (VM) CPU usage differ from physical systems?
In VMs, CPU usage reflects allocated resources rather than the host machine’s total capacity. Use hypervisor-specific tools like VMware vSphere or Hyper-V Manager to monitor VM CPU usage.
5. Is it possible to monitor CPU usage on smartphones?
Yes, on Android, apps like CPU-Z or System Monitor provide real-time CPU usage stats. On iOS, you can use third-party apps like iStat View to track performance metrics.
Conclusion:
Track CPU usage by monitoring active and idle times with tools like Task Manager, `top`, or Python’s `psutil`. Regular checks help optimize performance and identify issues.
Read Also:


