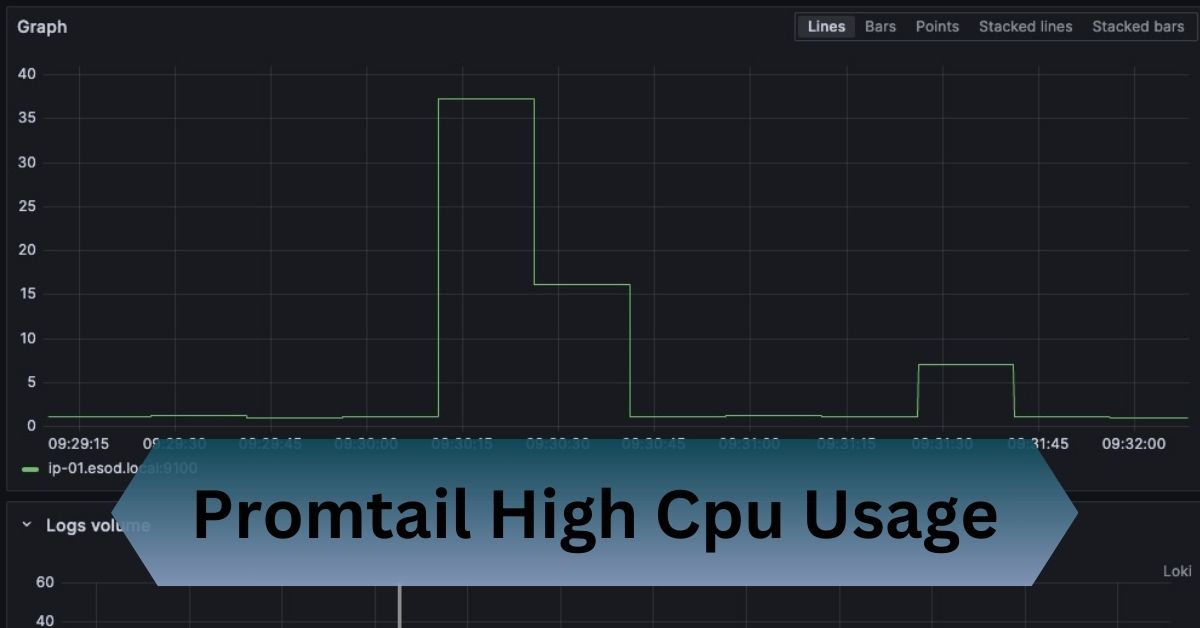
I once struggled with Promtail high CPU usage when managing logs for a busy Kubernetes cluster. The issue turned out to be overly complex regex rules in my pipeline. Simplifying them and updating Promtail drastically reduced CPU strain and improved performance.
Promtail high CPU usage often stems from large logs, regex inefficiencies, or frequent updates. Optimize configurations and monitor usage to reduce strain effectively.
Learn how simple tweaks in your configurations can save resources and boost performance effortlessly!
Table of Contents
What Is Promtail?
Promtail works as an agent in the Grafana Loki ecosystem, responsible for scraping, processing, and shipping logs to Loki. It reads log files, applies parsing rules, and sends formatted data upstream.
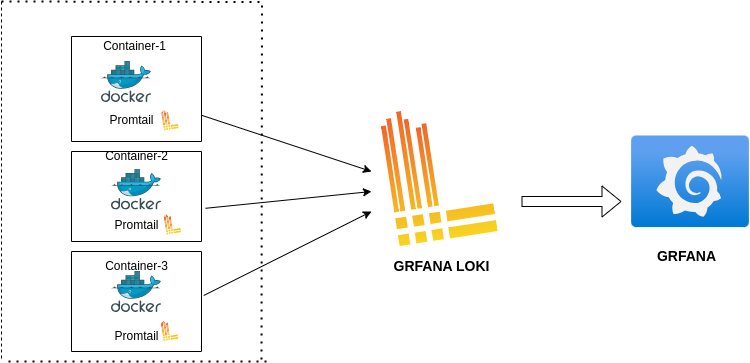
Whether you’re troubleshooting applications or monitoring infrastructure, Promtail’s efficiency directly impacts your log pipeline’s effectiveness.
However, when Promtail consumes excessive CPU resources, it can slow down systems, increase costs, or even miss critical log entries. Efficient resource usage is therefore crucial to maintaining a stable logging environment.
Why Does Promtail Matter?
Promtail acts as the pipeline between your log sources and Grafana Loki. It collects, processes, and routes logs, ensuring seamless integration with Loki for analysis and visualization.
While its flexibility and power are undeniable, these same attributes can lead to unintended resource consumption if not optimized correctly.
High CPU usage is a prominent challenge faced by users dealing with extensive logs or complex configurations. Optimizing log collection and processing pipelines can significantly reduce these resource strain issues.
Read Also: 2vcpu – Power Of 2vcpu For Scalable Solutions!
Key Causes of Promtail’s High CPU Usage
1. High Log Volume:
Large-scale environments, such as those in enterprise-level systems or Kubernetes clusters, produce vast amounts of logs. Promtail must handle all these inputs simultaneously, which can quickly overwhelm available CPU resources.
2. Resource-Intensive Regular Expressions:
Promtail’s processing capabilities rely on pipelines that use regex to parse and manipulate log data. However, poorly designed or overly complex regex patterns significantly increase CPU usage, especially when applied to high-frequency log streams.
3. Initial Log Scraping:
When Promtail starts, it scans all monitored log files to index and forward them. This “catch-up” process can create temporary but significant CPU spikes, especially in environments with a large backlog of log data.
4. Frequent Changes in Log Files:
Constant additions, deletions, or modifications to log files trigger Promtail’s monitoring processes. Environments with highly dynamic logs, such as application servers or databases, often experience increased CPU strain as Promtail processes these changes.
5. Improper Configuration:
Configuration issues, such as monitoring unnecessary files or setting excessively frequent scraping intervals, result in inefficient operations and elevated CPU usage.
6. Outdated Versions:
Older versions of Promtail may lack the optimizations and bug fixes present in newer releases, leading to higher-than-necessary resource consumption.
Impacts of High CPU Usage
- Performance Degradation: High CPU usage can slow down the host system, affecting the performance of other critical applications or processes.
- Increased Costs: Cloud environments often charge based on resource usage, making excessive CPU consumption a costly problem.
- Limited Scalability: Resource bottlenecks hinder the ability to scale your monitoring and logging stack effectively.
- System Instability: Sustained high CPU usage can cause system crashes, resulting in downtime and potential data loss.
Identifying the Problem
- Monitoring Promtail Metrics: Promtail exposes metrics such as promtail_cpu_usage_seconds_total. Tools like Grafana visualize these metrics, helping you pinpoint anomalies.
- Log Analysis: Check Promtail’s internal logs for errors, warnings, or processing delays. This often reveals underlying issues like unresponsive targets or misconfigured scrapes.
- Profiling CPU Usage: Linux tools such as htop or perf provide real-time insights into Promtail’s resource consumption. Profiling helps isolate processes consuming disproportionate CPU cycles.
Read Also: Ps5 Equivalent Cpu – The Best CPUs To Match Its Power!
Solutions to Reduce High CPU Usage
Optimize Configuration:
- Increase batch sizes to reduce processing overhead.
- Use realistic scrape intervals, avoiding aggressive settings.
Simplify Regex Rules:
Rewrite inefficient regex patterns for simplicity. Consider alternatives like structured logging formats, which eliminate regex needs entirely.
Manage Log Volume:
Filter out non-critical logs by:
- Defining exclusion rules in Promtail’s pipeline_stages.
- Using application-level logging filters to control verbosity.
Allocate Resources:
Deploy Promtail with sufficient CPU and memory allocations. Consider dedicated nodes or containers to avoid resource contention.
Horizontal Scaling:
Split workloads across multiple Promtail instances. Horizontal scaling ensures logs are evenly distributed, minimizing bottlenecks.
Proactive Steps for Long-Term Efficiency
Stay Updated with Community Insights:
The Grafana ecosystem boasts an active user community and robust documentation. Engaging with these resources can provide insights into optimizing Promtail configurations and resolving high CPU usage scenarios.
Test Before Production:
Conduct load testing to evaluate how Promtail performs under expected log volumes and configurations. This approach enables you to preemptively address potential CPU issues.
Automate and Simplify:
Where possible, automate log collection and processing pipelines to reduce manual intervention. Simplified configurations often result in more efficient resource use.
Invest in Observability Tools:
Incorporate monitoring tools to visualize Promtail’s resource usage over time. Identifying trends can help forecast future scaling needs and avoid resource bottlenecks.
Frequently Asked Questions:
1. What is the optimal CPU usage for Promtail?
Optimal CPU usage typically stays under 50% to maintain system stability. This allows headroom for potential spikes during periods of high load or demand.
2. How do I monitor Promtail’s resource consumption?
You can use Grafana dashboards for real-time monitoring of Promtail’s performance. Additionally, Promtail provides built-in metrics to help track CPU usage and optimize system efficiency.
3. Can Promtail handle multi-terabyte logs?
Promtail requires sufficient CPU and memory resources to function efficiently. Optimized configurations, such as appropriate batch sizes and filtering rules, are also crucial to maintaining performance.
4. Is regex parsing always necessary in Promtail?
Structured formats like JSON minimize the need for regex, enhancing processing speed and efficiency. This reduces CPU usage, making data handling smoother and faster.
5. What alternatives exist if Promtail isn’t scalable?
Tools like Fluentd and Filebeat offer enhanced scalability and flexibility, making them ideal for environments with heavy log processing. They provide more robust solutions compared to Promtail in such scenarios.
Conclusion:
Promtail high CPU usage often arises from handling large log volumes, complex regex patterns, or frequent file changes. Simplify configurations, update Promtail, and monitor usage to maintain efficiency.
Read Also:
